O&G doesn't lack data. It lacks direction.
0+ compressors tracked. Every insight tied to action.
Raw Intelligence
- •0+ units tracked
- •5 major vendors analyzed
- •All L48 basins covered
- •Quarterly financials parsed
- •Contract terms benchmarked
Actionable Analysis
- •Vendor health scores (RRS)
- •Your BATNA strength: Strong
- •Optimal call sequence
- •Rate positioning vs. market
- •Leverage points identified
Ready to Execute
Negotiation Playbook:
Call Vendor X first.
Pitch $XX.XX/HP/mo
Ask for X-month credit
Opt-out clause below XX% uptime
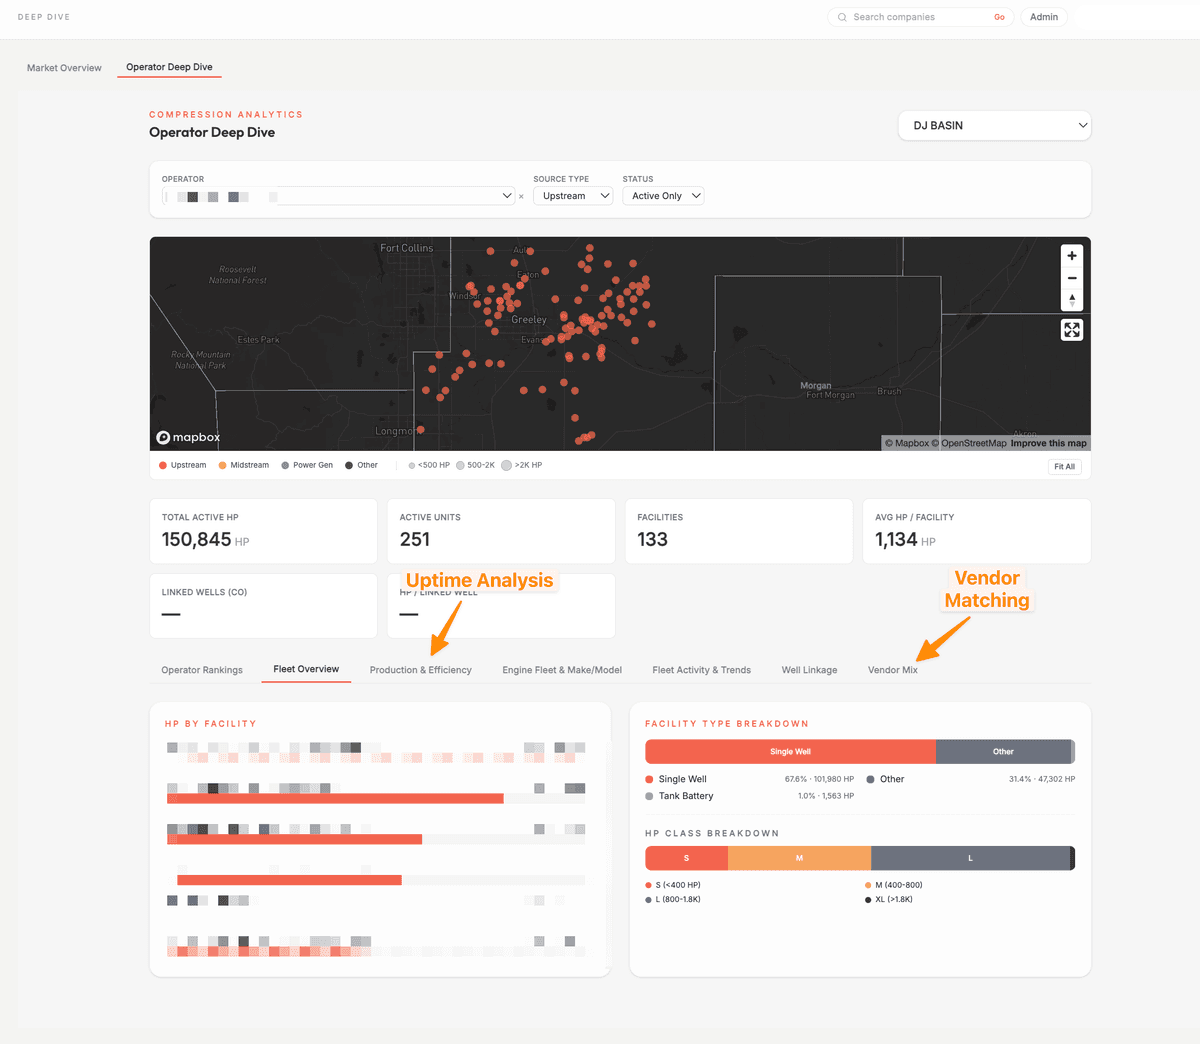
Vendor Market Share
Who has leverage in your basin
Uptime Benchmarks
Who performs best by HP class and unit size
HP Addition Trends
Where capacity is tightening or loosening
Three Intelligence Layers
From raw data to actionable leverage
Layer 1
Fleet Map
Comprehensive view of every compressor in the Lower 48 via air permit data linkage with ML-powered vendor attribution.
- •Track ~16,500+ units across major vendors
- •36-month primary term expiry estimation
- •Production linkage for runtime performance
Layer 2
Market Intelligence
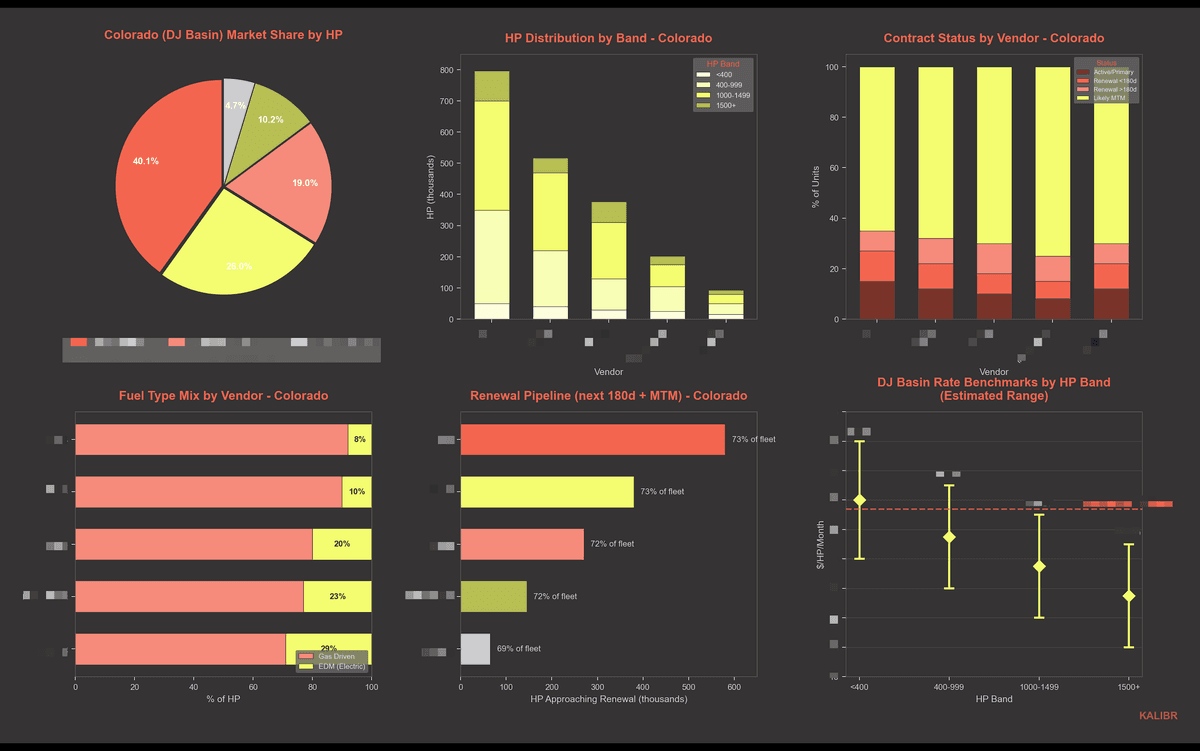
Pricing benchmarks derived from consulting engagements and verified transactions.
- •$/HP/month by basin and HP tier with P10/P25/P50/P75/P90 distribution
- •Vendor health scores from SEC filings
- •Contract calendar with 90-day negotiation windows
Layer 3
Negotiation Intelligence
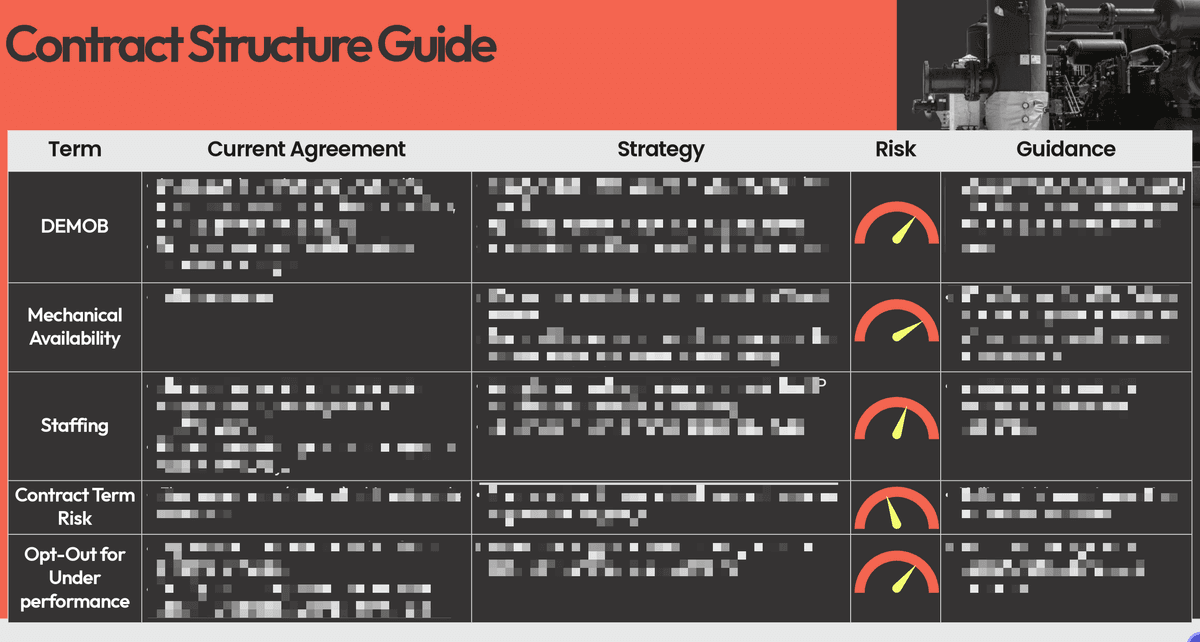
Turn market data into leverage with structured negotiation support.
- •BATNA scoring with strength tiers
- •Vendor call sequencing based on alternative scores
- •MESO offer templates
Reliability Risk Scoring (RRS)
Financial signals that predict operational performance before it shows up in vendor results.
MIR - Maintenance Intensity Ratio
Maintenance investment per revenue-generating HP per quarter.
Measures: Equipment condition
Warning Signal: Declining MIR + flat utilization
Interpretation: Deferred failures accumulating
LLI - Labor Leverage Index
Revenue-generating HP per dollar of field labor cost.
Measures: Labor availability
Warning Signal: Rising LLI + fleet growth
Interpretation: Technician stretch building
FRVS - Fleet Renewal Velocity Score
Implied annual fleet renewal rate based on CapEx vs. replacement cost.
Measures: Fleet age / refresh rate
Warning Signal: FRVS below 2.5%/year
Interpretation: Fleet aging faster than replacement
Composite Score
Weighted combination of all three metrics. Higher score = lower reliability risk.
Common Questions
What does compression cost per HP per month?
It depends, and that's the problem. Compression rates vary significantly by basin, HP class, contract term, fuel type, and vendor. Spot rates run 20-25% above fleet averages. Large HP units command a utilization premium. What most operators don't realize is that the spread between what you're paying and what you could be paying is often wider than the spread between vendors. Kalibr provides benchmarks at the basin-HP tier-vendor level with P10/P25/P50/P75/P90 distribution so you can see exactly where your rate sits.
How do I know if my compression rate is competitive?
Most operators negotiate blind. Without basin-specific pricing data, you cannot tell if a quoted rate reflects market conditions or vendor margin capture. Kalibr benchmarks your rate against anonymized transaction data by basin, HP tier, vendor, and fuel type. A rate that looks competitive in the Permian may be 15% above market in the Powder River. Context is everything.
Why can't my compression vendor lower the rate?
Compression vendors operate under a levered real estate model. Monthly rental rates are backed into from target return thresholds (typically 15-20% unlevered IRR). A rate cut on one contract forces portfolio-wide repricing, triggering auditor scrutiny and covenant tests on the vendor's entire fleet. This is an accounting constraint, not a negotiating posture. The lever is off-book concessions: free months, waived mobilization, performance credits, and payment terms. These deliver equivalent economic value without forcing balance sheet reclassification.
What is a Reliability Risk Score?
Kalibr's Reliability Risk Score (RRS) is a 0-100 composite that predicts vendor operational reliability from financial signals before problems show up in the field. It combines three metrics: Maintenance Intensity Ratio (MIR), which measures maintenance spend per HP to detect deferred maintenance; Labor Leverage Index (LLI), which measures HP per labor dollar to identify technician understaffing; and Fleet Renewal Velocity Score (FRVS), which measures annual fleet replacement rate to flag aging equipment. Higher score means lower reliability risk.
How long are compression equipment lead times?
Large HP engine lead times have roughly doubled over the past year, with most vendors now quoting 100+ weeks for Caterpillar large horsepower units. This is driven by engine allocation competition with power generation. Your compression vendor is competing for the same engines as data center developers. New compression capacity ordered today likely won't deliver until 2028, structurally limiting supply growth and giving vendors pricing leverage.
What is BATNA scoring for compression vendors?
BATNA (Best Alternative to Negotiated Agreement) scoring is Kalibr's 11-dimension assessment of each vendor's negotiating position, scored 1-10 per dimension. Higher scores indicate weaker vendor position and more E&P leverage. Dimensions include leverage and debt pressure, utilization slack, basin concentration, customer concentration, PE fund lifecycle position, and six others. Scores are calculated per basin. A vendor strong in the Permian may be weak in the DJ Basin. Operators should engage weak-BATNA vendors first to establish pricing anchors.